Geneos GA5.0
Geneos GA5.0 Release Highlights
This Geneos release is a major release – it is a major milestone in terms of features as well. Our focus in the past year has been on building integrations, providing strong APIs and improving the User Interface to Geneos. This release is the culmination of those efforts. Our latest integration allows for log storage, searching and queries all through the power and flexibility of Elasticsearch. The introduction of centralized configuration has been a key theme of Geneos releases in the past year and this latest release adds a REST-API to centrally manage your Geneos configuration files. This release also introduces the new Web Console. This is a brand-new web-based real-time monitoring UI that greatly improves on the charting and incident investigation capabilities of the Active Console. Speaking of the Active Console, when upgrading to this release you will find a fresh look and various usability improvements in your favorite real-time monitoring tool.
Let’s look at some of the features in more detail:
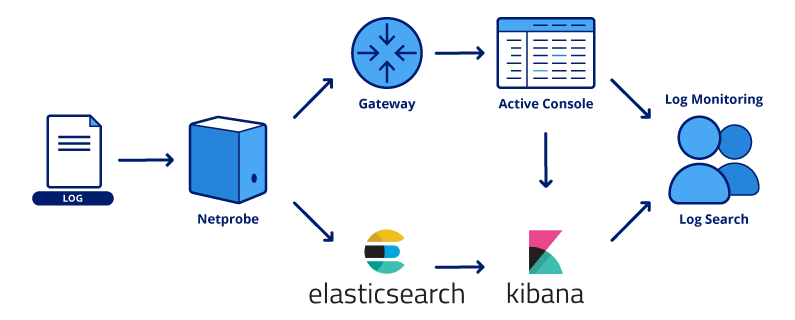
Net Probe to Elasticsearch
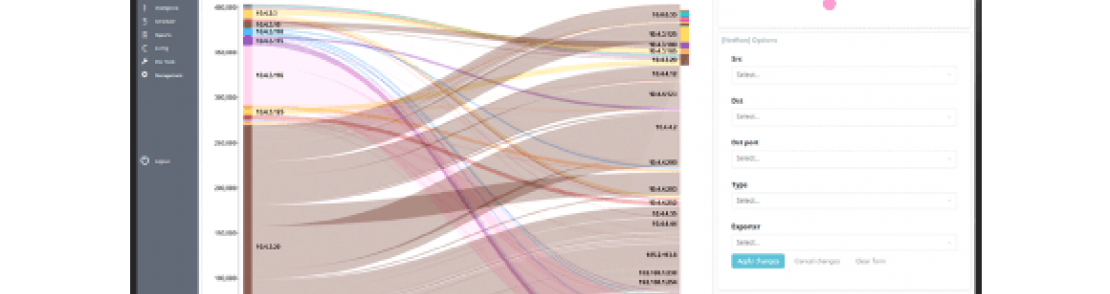
We have made log storage easy and convenient in GA 5.0 by providing a new plugin that can stream log data from the Netprobe to Elasticsearch. As a Geneos power user you probably have 100s, if not thousands FKMs configured for log monitoring. The new outbound streaming feature allows you to mark your already existing logs for streaming into Elasticsearch. Every log message will be enriched with valuable Geneos context, enabling the user to search by Managed Entity, severity and matching or ignored keywords. An integrated workflow lets you go from a data view in Geneos to searching logs across all your hosts with few simple clicks.
For more information, see the following documentation:
Centralized Configuration API
With increasingly complex and dynamic environments it’s becoming paramount to have one single place to manage your applications’ configuration and this goes for the monitoring tools as well.
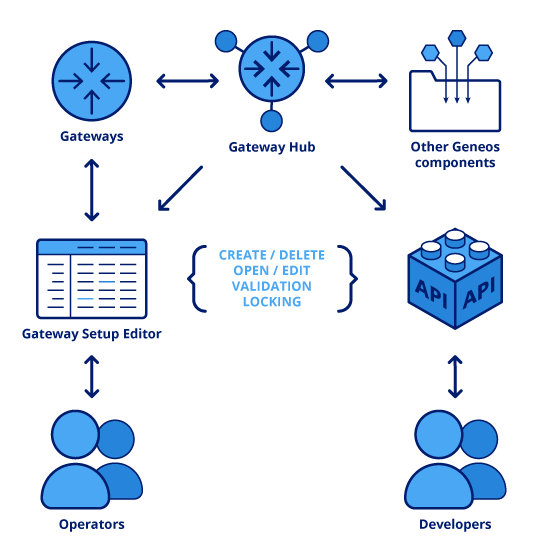
The Centralized configuration feature allows you to centrally store and manage configurations for all your Gateways through a REST API. The Gateway Hub REST API lets you create, edit, delete, validate, and lock Gateway configurations.
Future enhancements will include centralizing the Net probe and Active Console configurations as well.
For more information, see Centralized Gateways User Guide.
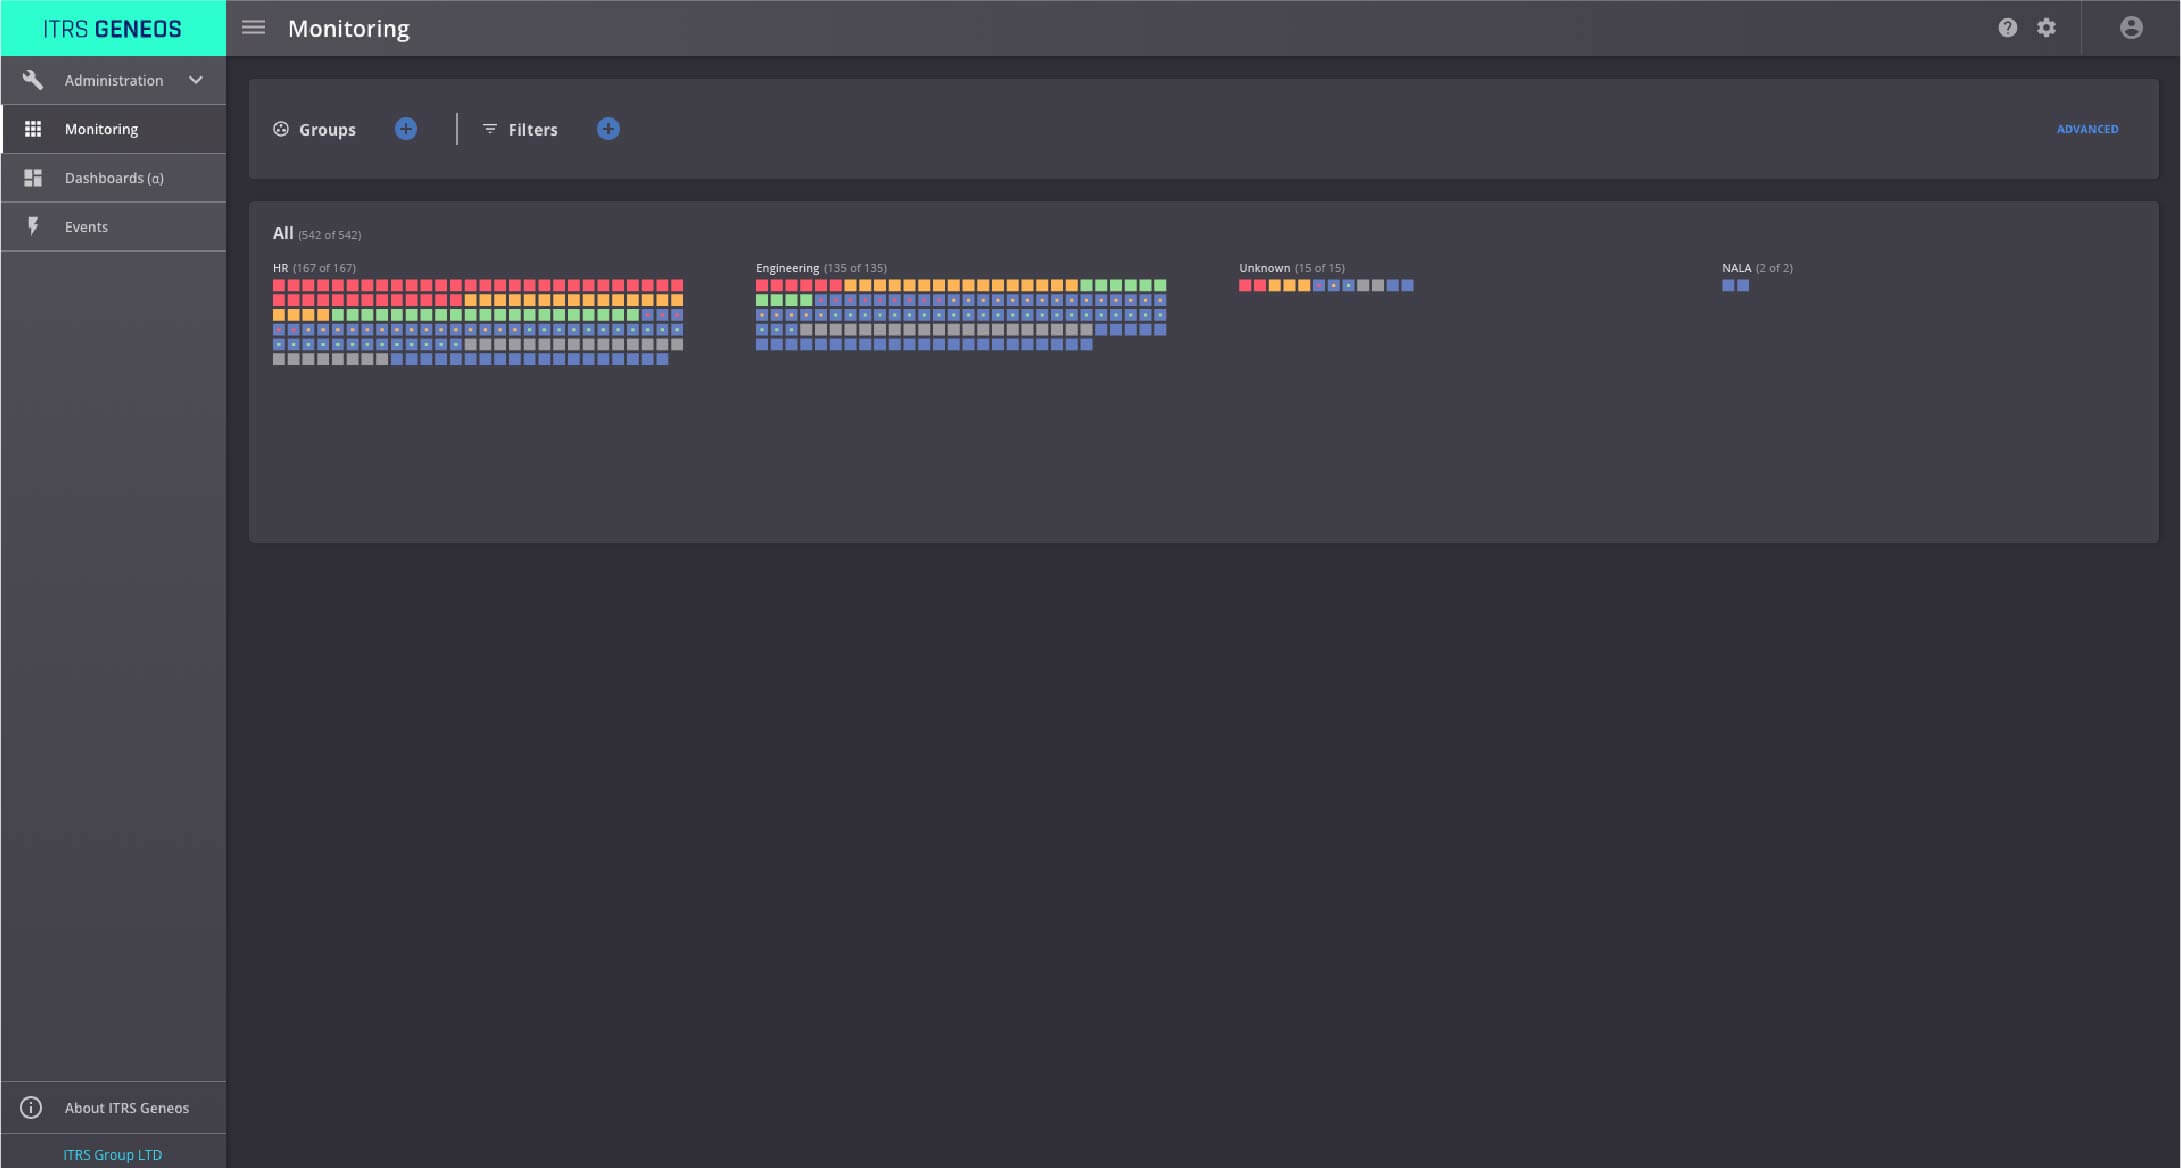
Web Console
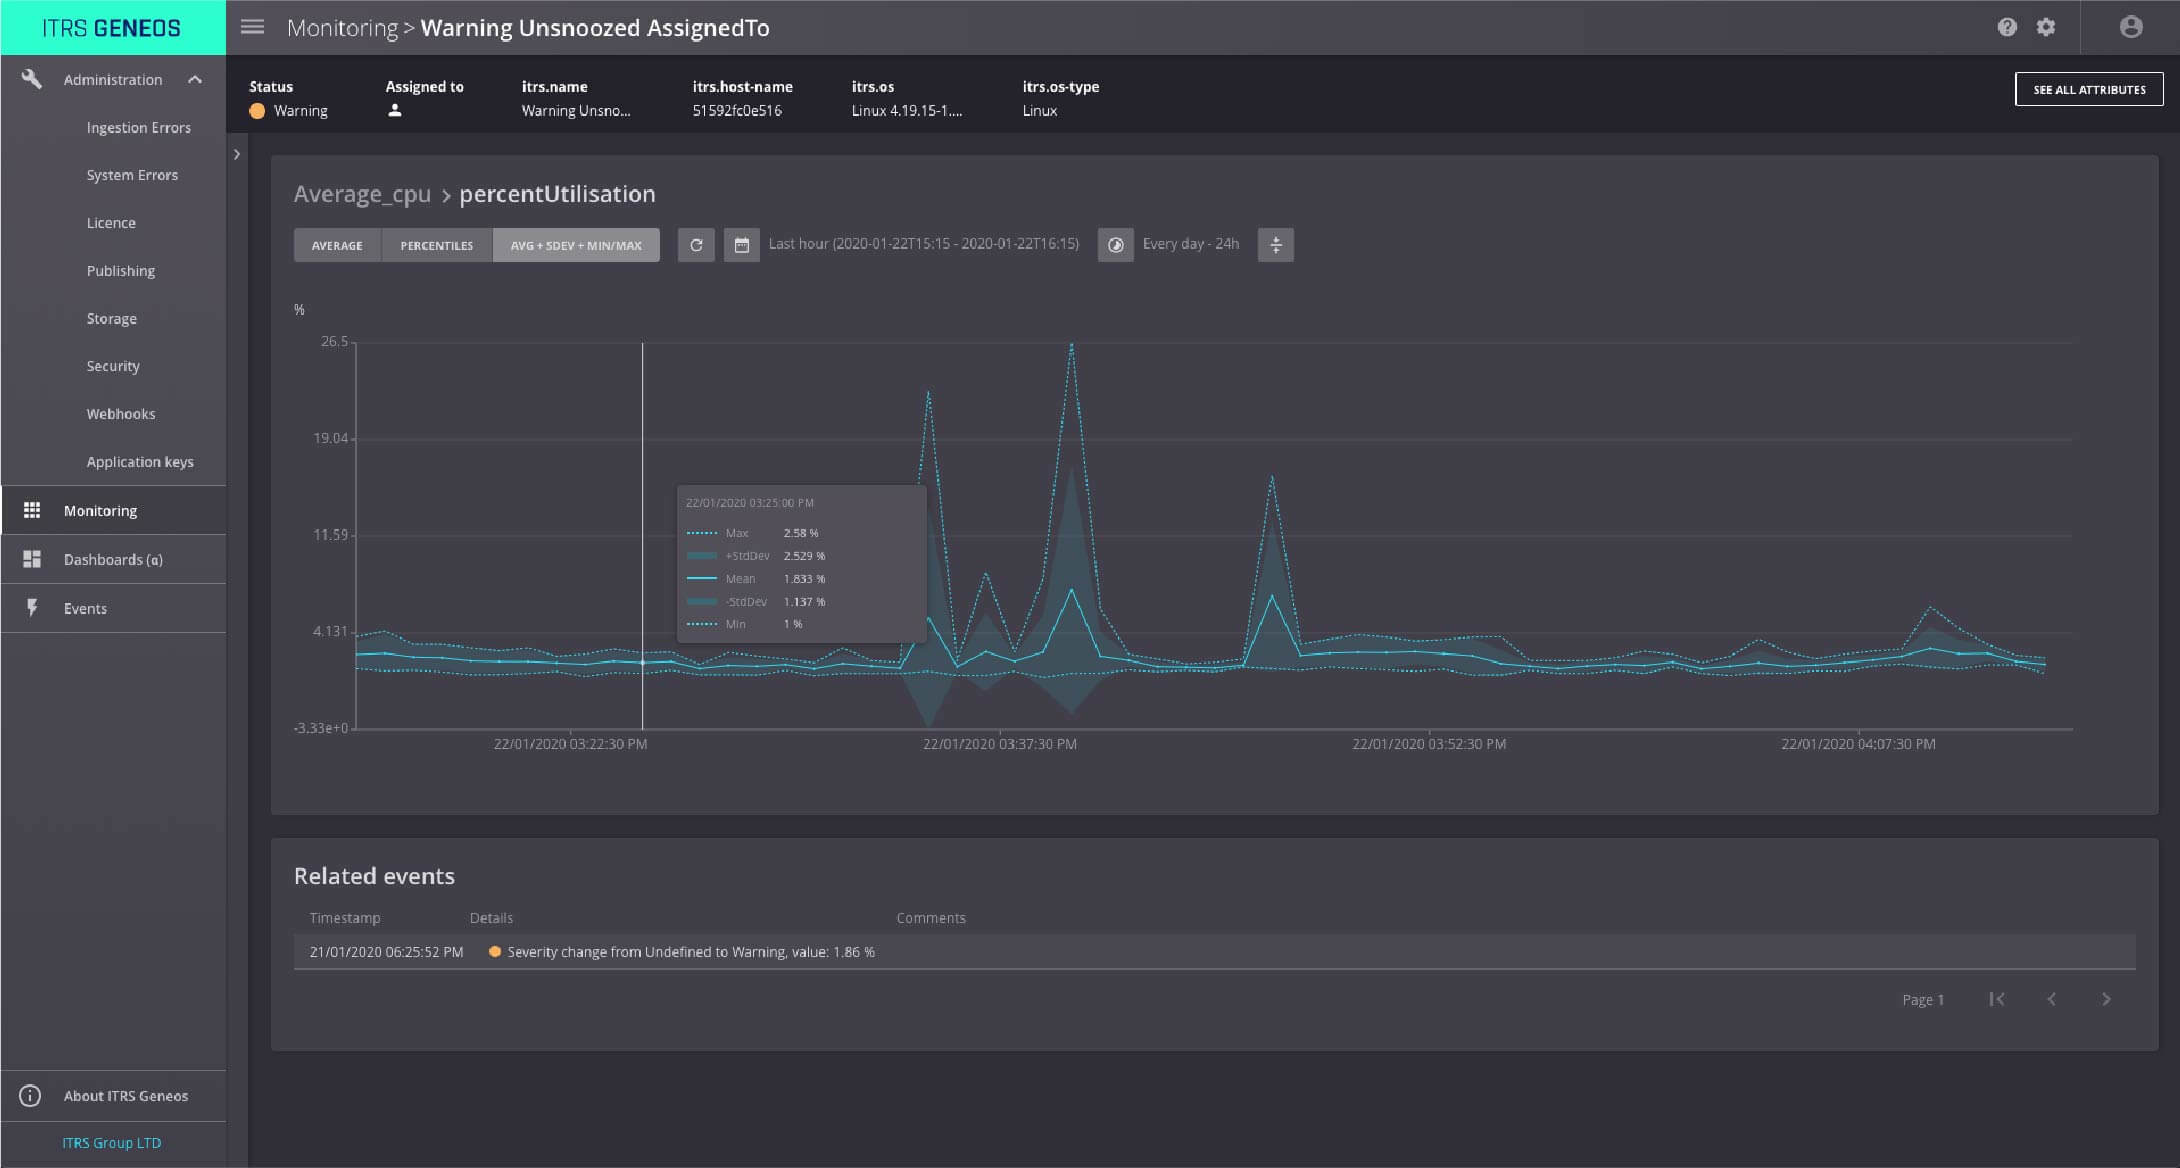
The Web Console monitoring UI brings a brand-new look for real-time monitoring to supplement the Active Console. It allows you to visualize the entities across your monitored estate with grouping and filtering capabilities to customize your view. Advanced filtering lets you use the complete filter syntax to easily find your entities in large enterprise environments.
Visualize history of a metric along with a useful aggregate functions such as average, percentile and standard deviation.
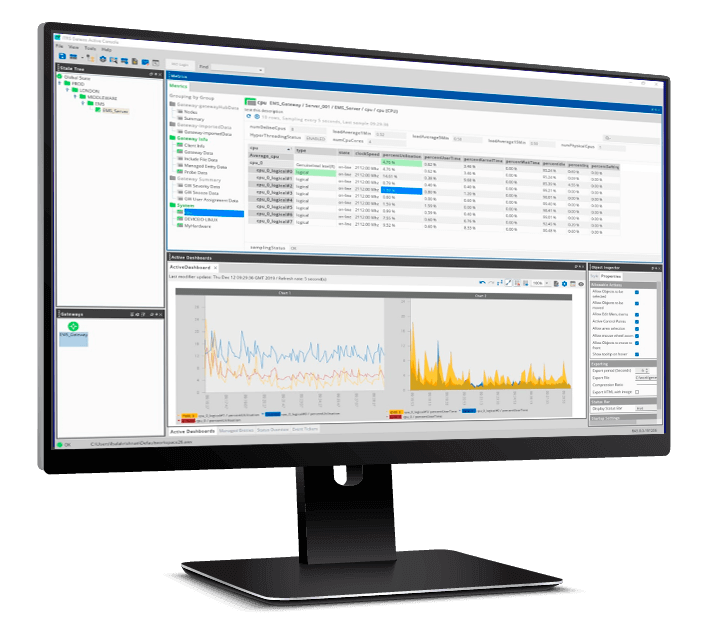
New Active Console Interface
Active Console remains the primary UI for many Geneos administrators. The Geneos 5.0 release introduces a refreshed light themed interface and improvements:
- New icons, fonts, and form controls.
- New default work space.
- New Active Chart widgets.
It also includes an on-boarding screen to help users get started with Active Console, see Introduction to Active Console.
Geneos GA5.0 also includes a variety of other important features and enhancements, which can be found here.
In upcoming releases of Geneos, we will focus on making the product fit more seamlessly with the DevOps pipeline and to reduce the noise from monitoring. We have been working hard at making Geneos run natively in orchestrated environments and in cloud environments. Our goal is to make our tools become part of the development pipeline, with easy and modern deployments and providing inside the app monitoring capabilities out of the box with minimal configuration.
Our second focus is noise reduction. We can achieve that by transitioning users from traditional rules with pre-defined thresholds to automatic base lining, anomaly detection and discovering correlations between metrics, events and logs. These are all capabilities we are bringing to our monitoring suite.
To learn more how ITRS can support you to monitor your IT estate, please contact us.