
Cloud observability coverage without compromise
Blind spots break systems. In hybrid IT environments, teams are forced to throttle metrics by frequency or number, trading visibility for cost. The result is missed anomalies, unexplained latency, and longer outages.
We believe customers shouldn’t have to choose. Monitoring shouldn’t be a budgeting exercise, it should be a strategic enabler. Imagine what’s possible when every signal can be captured at 1-second fidelity, without compromise.
Why fragmented observability slows teams down
Hybrid environments have outpaced the tools meant to monitor them. Metrics, logs, and events are scattered across vendor consoles, point solutions, and niche dashboards, each capturing only part of the picture. Instead of unified visibility, teams are left piecing together fragments when every second counts.
This creates three pain points engineers know too well:
- Disparate tools that force context switching during every investigation.
- Gaps in visibility when incidents span cloud-native and traditional systems.
- Slower root cause analysis (RCA) as teams stitch signals together manually.
A 2024 study found 33% of organizations cite alert fatigue as the #1 barrier to faster incident response. For engineers on the front lines, a better approach is overdue."
How unified observability works (under the hood)
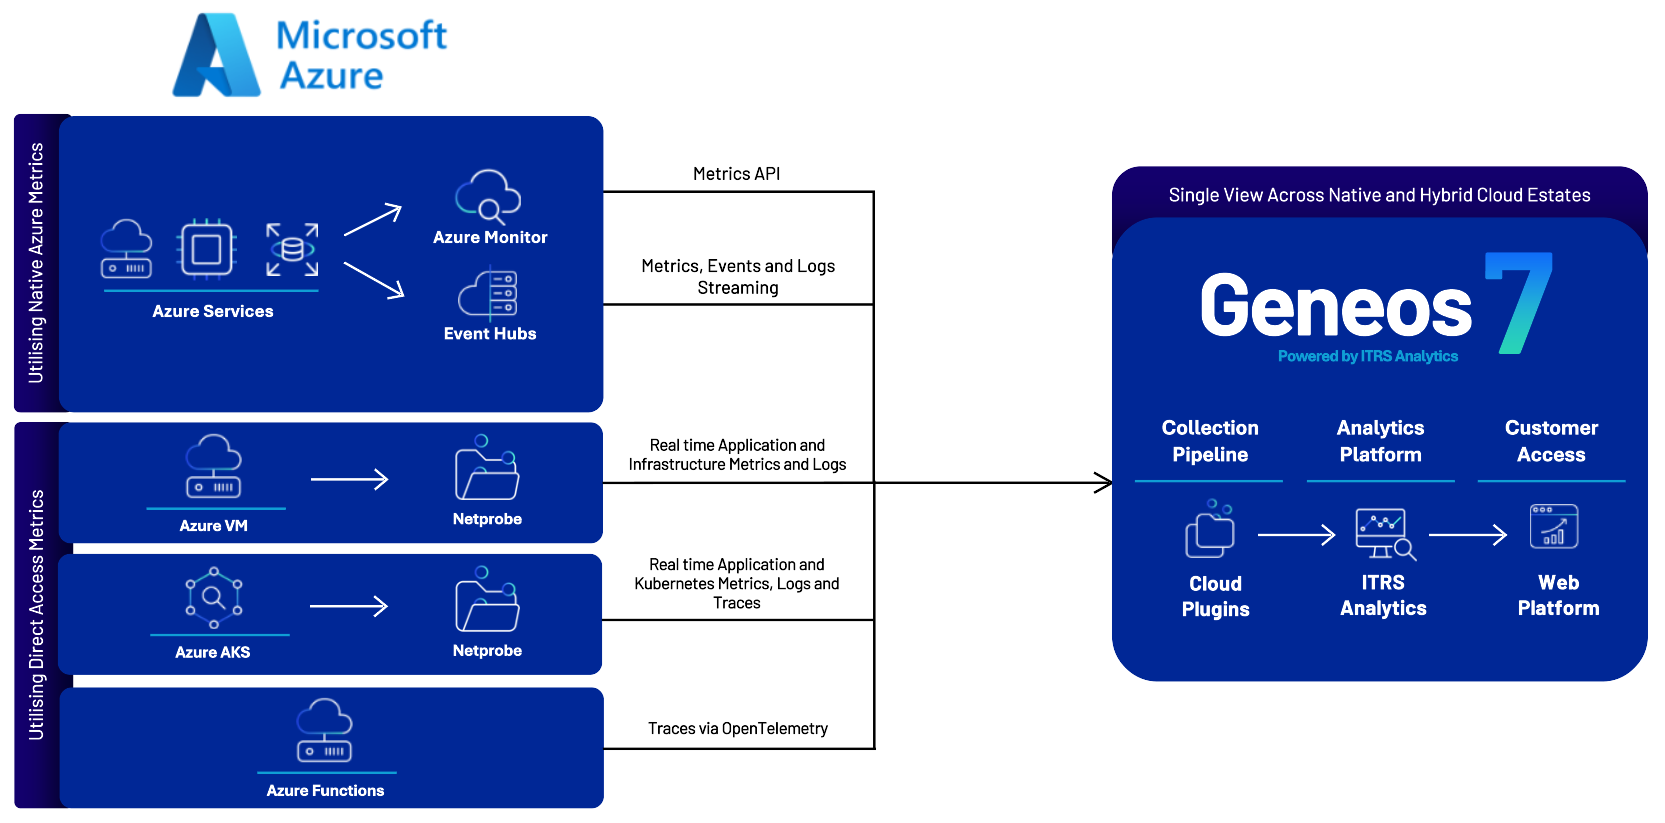
ITRS delivers a single telemetry pipeline that ingests, normalizes, and correlates signals across infrastructure, applications, and cloud-native services. Instead of splitting metrics, logs, and events across vendor-specific tools, everything is captured into a unified data model that gives engineers consistent visibility across all services.
We’ve recently expanded our coverage to include key cloud-native and data services including AWS Redshift, Apache Airflow, Azure Data Factory, and Azure Synapse Analytics, ensuring visibility keeps pace as architectures evolve.
Critically, our platform removes the trade-offs that plague most cloud monitoring setups. Engineers can collect any number of custom metrics down to 1-second frequencies without fear of bill shocks.
The result is comprehensive coverage, full fidelity, and unified observability across hybrid, multi-cloud, and AI-driven environments.
Real-world use cases
Customer Use Case: Data Pipelines and Analytics in Azure
A global financial services customer recently migrated from an on-prem enterprise data warehouse to the Azure cloud platform, powered by Azure Data Factory and Azure Synapse. Their monitoring challenges were clear:
- Existing monitoring tooling using PowerBI offered only retrospective views of pipeline runs, often delayed and incomplete.
- Operations teams had to manually check logs across multiple systems to diagnose failures.
- Business stakeholders lacked real-time visibility to confirm whether overnight reporting pipelines had run successfully.
With Geneos’ new cloud monitoring capabilities: Azure Data Factory: Geneos now collects pipeline run status, execution times, failure events, and throughput, while comparing against historical baselines to flag anomalies (e.g., a job running significantly later than normal). Azure Synapse: Provides insights into query performance, resource utilization, and workload execution trends, enabling both proactive issue detection and faster resolution.
Impact: Ops teams resolve pipeline issues directly in Geneos without manual log gathering. Business owners gain real-time dashboards showing overnight pipeline status and performance trends. Historical analysis is automated, replacing manual spreadsheet tracking of pipeline runtimes.
This combination of real-time monitoring and historical baseline analysis ensures both IT and business stakeholders can rely on Geneos for operational assurance and confidence in the new cloud-based data hub.
How It Works
Geneos integrates with these cloud services using native APIs provided by AWS, Azure, and GCP. The monitoring plugins collect structured data such as: Pipeline metrics (status, execution time, error counts), Resource utilization (CPU, memory, storage, concurrency), Query and model performance (latency, throughput, errors) , and Logs and events (pipeline failures, audit/security events).
This data is ingested into Geneos, correlated with existing infrastructure and application monitoring, and visualized via real-time dashboards. Geneos’ powerful rules engine then applies thresholds and anomaly detection to trigger alerts for late pipelines, slow queries, or degraded AI inference performance.
Benefits for operations teams
High-Fidelity Metrics: Capture any number of custom metrics at 1-second frequencies without bill shocks.
Unified Visibility: Eliminate tool sprawl with a single pane of glass across infrastructure, applications, and cloud-native services.
Expanded Coverage: Monitor AWS Redshift, Apache Airflow, Azure Data Factory, Azure Synapse Analytics, and more alongside traditional systems.
Faster RCA: Correlate signals across hybrid and multi-cloud environments to resolve incidents in minutes, not hours.
The outcome? Complete coverage, faster investigations, and observability that scales with modern cloud and AI-driven architectures.
Why it matters in mission-critical environments
In capital markets, a missed signal can mean millions. In digital payments and AI-driven services, downtime erodes customer trust instantly. Blind spots are not an inconvenience, they’re an existential risk.
Cloud observability without compromise empowers engineers to:
- Maintain complete visibility across hybrid, multi-cloud, and AI workloads
- Detect and resolve issues at full fidelity, down to 1-second metrics
- Confidently adopt new cloud services without introducing blind spots
The result is resilient systems that keep pace with the speed and complexity of modern architectures.
Build resilient systems without blind spots
When every signal is captured in a single platform at full fidelity, you resolve issues faster, adopt new services sooner, and keep critical systems online without compromise.
See our extended Cloud Monitoring support in action
Ready to go deeper? Book a custom demo and discover how Geneos 7 extends real-time observability into cloud data platforms—giving you end-to-end visibility from ingestion to analytics. Spot bottlenecks early, prevent compliance risks, and keep pipelines flowing without disruption. Seamless monitoring, zero blind spots, total control.
Learn more about extended Cloud Monitoring support in Geneos 7