
Using Geneos Elasticsearch Monitoring Integration Template to monitor Elasticsearch
Exciting new Geneos integration - Elasticsearch
Elasticsearch is a distributed search and analytics engine that is used in a variety of functions in different organizations. It is one of the key big data technologies used in financial services today. It is typically deployed as a cluster of nodes as it is horizontally scalable, i.e. if there is an increase in data to be stored or in search operations, more nodes can be added to distribute the load.
Because of the amount of data and the number of servers involved in Elasticsearch deployments, it is necessary to monitor and manage the Elasticsearch environment to make sure that everything is running smoothly and efficiently. Elasticsearch provides monitoring APIs that return JSON or text output to keep track of the status of the cluster and the elements within it. But, as the cluster scales to hundreds of servers, it becomes quite impossible to manually read through this output, analyze the metrics, and spot some red flags.
ITRS has made it easier to visualize and analyze these metrics in Geneos through the recently released Elasticsearch Monitoring Integration Template. The template contains pre-configured Toolkit samplers that execute scripts that gather Elasticsearch metrics via _cat API. This configuration template can be easily integrated into Geneos set-ups, with very little configuration left for the users to do. The template sets up a number of dataviews that allow users to track several key areas in Elasticsearch.
Cluster Health
One of the basic elements that need to be monitored in Elasticsearch is the cluster, which is a group of nodes that make up the entire Elasticsearch environment. The Elasticsearch-ClusterHealth dataview shows data on the overall health of the cluster, the number of running nodes, and the status of the shards. (For more details on basic Elasticsearch concepts/terms, please read https://www.elastic.co/guide/en/elasticsearch/reference/6.2/_basic_concepts.html)
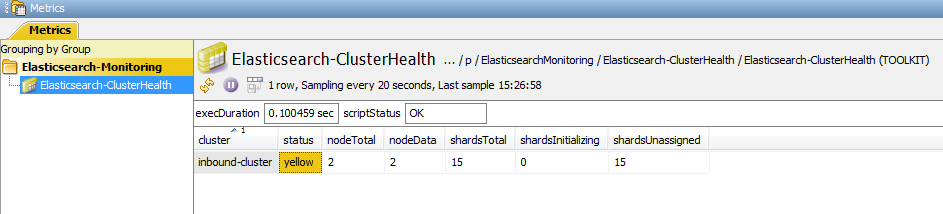
The most important information here is the status column. It gives us an overall view of the cluster. When it is in yellow status, all primary shards are allocated (i.e. no data is missing and results will still be complete), but one or more replica shards are missing. It should be investigated, otherwise, you might lose data if more shards disappear. Red means that at least one primary shard is missing and that you are missing data. Alerts can be set-up here to track if it is in yellow or red states for too long.
The counters for the shards are a good indicator of the cluster status. Shards typically start in “initializing” state, when they are first created or during restarts. But this is supposed to be a temporary state, before they switch to “started” or “unassigned” state. If they remain in “initializing” for too long or is “unassigned”, it could be a warning sign that the cluster is unstable. Additionally, one can also set-up charts to check the number of nodes and shards to visualize how the number of nodes in the cluster recover during restarts.
From the number of running nodes, we can see if there are missing nodes. Say, you expect 3 nodes to be running, but only see 2 running nodes, then you know that 1 of your nodes is missing. You can then cross-reference the list of running nodes on the cluster through the Elasticsearch-NodeInfo dataview.
Search Performance
With Elasticsearch being a search engine, one of the key performance metrics that affect user experience is the search performance. Elasticsearch search operation involves 2 phases – query and fetch. Query is sent to and executed in every shard in the index. From the results of the query, only the related documents will be fetched from the relevant shards. The query phase takes longer than the fetch phase, as only relevant documents are fetched in the latter phase.
These 2 metrics are important in monitoring the cluster’s search performance. In the integration templates, these metrics are shown in the Elasticsearch-SearchPerf-ByNode and Elasticsearch-SearchPerf-ByIndex. The main difference between these two is that the metrics are grouped by node (which contains one or more indices) in the former, and by index (which is spread across one or more nodes) in the latter.
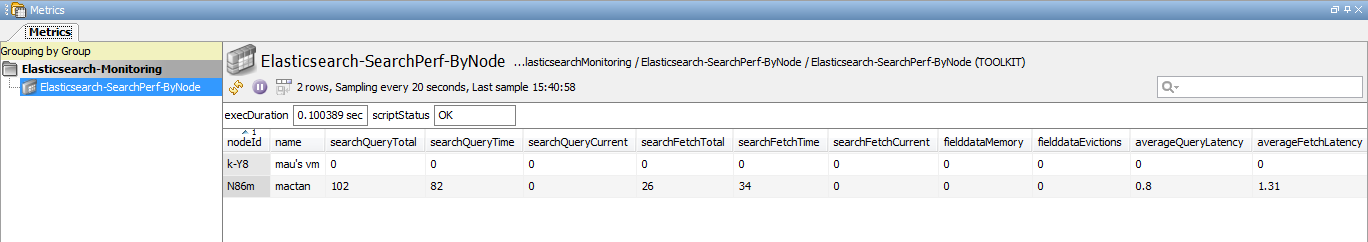
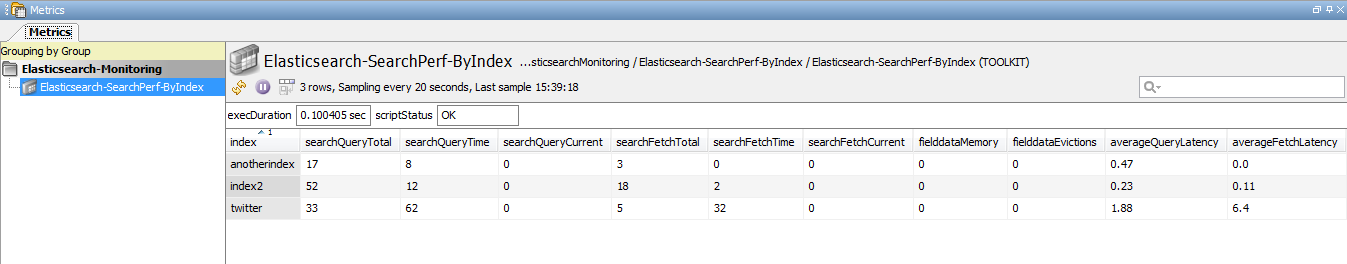
The number of current query operations gives us an idea on the number of requests that the index or the node is servicing at a given time. The query latency and fetch latency of an index is a good indicator if one needs to optimize the query to make it more specific and reduce the number of results. The query latency and fetch latency of a node could also indicate some possible bottlenecks in the nodes that need to be investigated, such as slow disk IO etc. Based on these metrics, one can investigate further if the cluster is not efficiently configured, or if additional nodes need to be added.
Indexing Performance
Another key performance metric to monitor is the indexing performance. Indexing is the process of storing documents in Elasticsearch and making it searchable. It occurs when new information on an index is added or updated and involves 2 main operations – refresh and flush. Refresh writes the new/updated information to an in-memory segment and makes it available for search. At this point, the data is not yet written to a persistent storage (except for a transaction log which is stored in persistent memory). The flush operation eventually writes the data to a persistent storage, which means it is a more expensive operation, and so is done less frequently.
Refresh and flush times are configurable in Elasticsearch, with refresh time happening every 1sec by default, and flush time less frequently, such as when the transaction log reaches a particular size. (See details in https://www.elastic.co/guide/en/elasticsearch/guide/current/translog.html)
In the Elasticsearch Integration Templates, there are two dataviews presented to monitor the indexing performance – Elasticsearch-IndexingPerf-ByNode and Elasticsearch-IndexingPerf-ByIndex. Both contain similar metrics – indexing, refresh, and flush metrics. The main difference is that in Elasticsearch-IndexingPerf-ByNode, the metrics are grouped per node, while in Elasticsearch-IndexingPerf-ByIndex, the metrics are grouped per index.
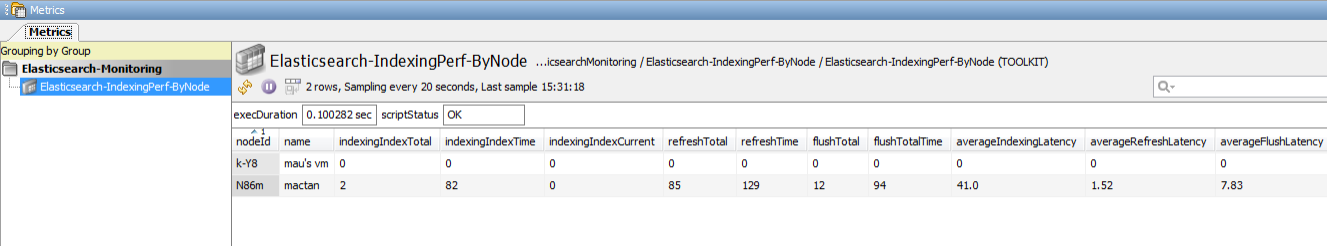
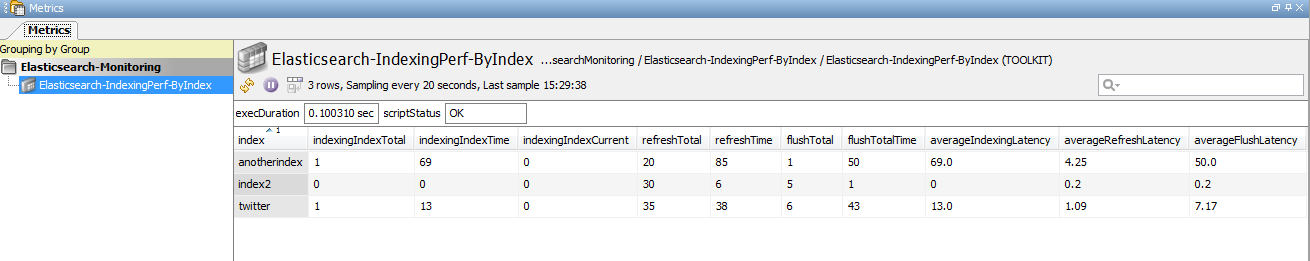
From the metrics, one can track unusual changes in indexing rate, which could indicate trends with the data sources. It could also indicate some underlying issues in the Elasticsearch configuration which may need to be optimized. If the metrics indicate that the refresh latency is too slow, one can reconfigure the refresh interval especially when the newly indexed data does not need to be searchable right away. If the flush latency is too slow, one can check which node is the slowest and check if there are problems with the disk, etc. One can also play around with the flush threshold size to see what works well with your environment.
Node Resource Information and Thread Pool
Elasticsearch performance highly depends on the machine it is running on. The Elasticsearch-Resource dataview provides metrics on the machines that the Elasticsearch nodes are running on and aides in giving the users view of the health of the nodes.
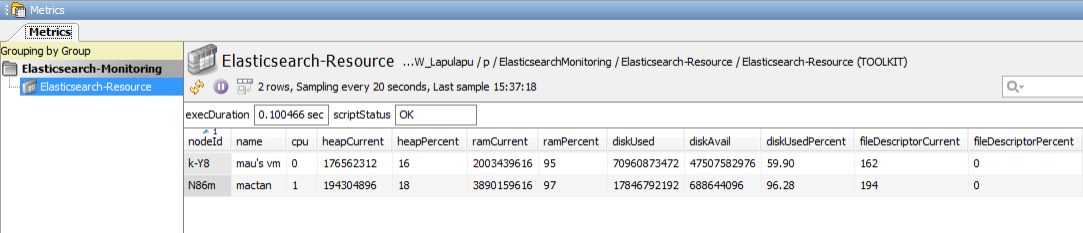
An increasing CPU usage could mean that the load is already heavy and that more nodes may need to be added to distribute the load. Disk space should also be monitored to make sure that there is enough space for new or updated indices. If a node is almost full, you may need to start taking action like adding new nodes, decluttering indices, etc. Same goes for other metrics like open file descriptor, RAM usage, etc. Alerts can be set on these values, depending on the machine capacity, so that users are notified when reconfiguration on the machine or Elasticsearch environment needs to be made.
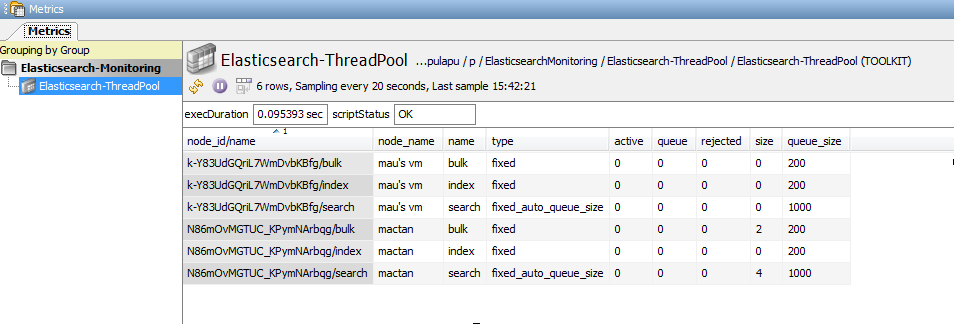
A node makes use of thread pools to improve thread memory consumption. These pools have queues which hold pending requests. Monitoring these pools are important to see if the node is able to handle the load of requests. Selected thread pools are monitored in Elasticsearch-ThreadPool dataview. A red flag would have to be a non-zero value in the rejected column, which happens when the queue is already full and could no longer accept pending requests. Warnings can also be set if the queue is already nearing full capacity.
Nodes
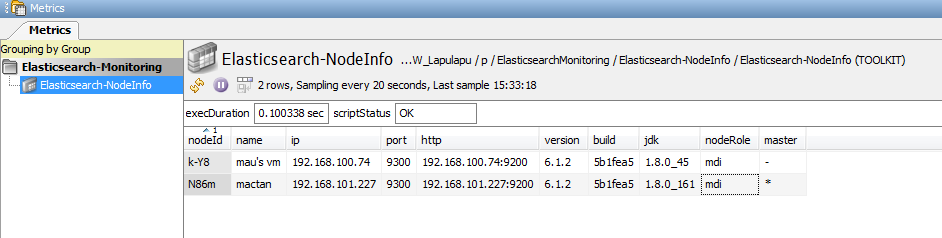
The physical instance of an Elasticsearch cluster is a node. It represents a running instance of Elasticsearch, which belongs to a cluster. In most of the dataviews mentioned above, there is a reference to a node instance where the actual configuration can be performed. The Elasticsearch-NodeInfo dataview displays a list of running nodes of a cluster and their corresponding information to make it easier for the users to reference the node, when needed.
All in all, the Elasticsearch Monitoring Template provides metrics to help users monitor search and index performance, diagnose inefficient operations, ensure that the cluster is healthy and nodes are running, and that machines running the Elasticsearch are in excellent shape. Warning alerts can be set-up so that the administrators are notified when the set-up is nearing its full capacity and act on it before the operations start to fail. In severe or unexpected cases, critical alerts can be set-up so that actions can be taken immediately. This combination of dataviews helps the users to diagnose and assess the next step (e.g. reconfiguration of Elasticsearch settings, addition of more nodes, upgrade of machines, etc.) ensuring minimum downtime and maximum performance of your Elasticsearch environment.