Building a MiFID II dashboard that anyone in the business can interpret
With the implementation of MiFID II, many of our clients are preparing to find out exactly how ready for the regulatory changes they are. It isn’t just technical or support staff who need that understanding, but rather the business as a whole. The two dashboards pictured within this blog are a good example of how Geneos is helping ITRS customers, business-wide, to ensure they have nothing to worry about. In order to be logged, transactions must move through a number of internal systems, including file transfer and database logging activities, before going out to the regulator and then finally notifications are sent back to the client. Under MiFID II the time between the trade being made and logged with the regulator is subject to strict SLAs.
The support team is often responsible for maintaining systems and flows in this space, when things go wrong the business needs to understand their exposure in terms of volumes of trades that may (or have) missed their SLAs.
Early dashboarding plans are often focused on the systems’ health. Dashboard content is often a direct translation of the infrastructure diagrams the support teams might keep in paper stacks on their desks or pinned to their backdrops. However, when things break, and selected elements of the infrastructure acquire critical and warning status, it still requires support level SME knowledge to interpret the impact of the missed SLA. Which means that Support have to say “We have a problem”, the business ask what’s the impact, and support then provide their estimate in terms of SLAs.
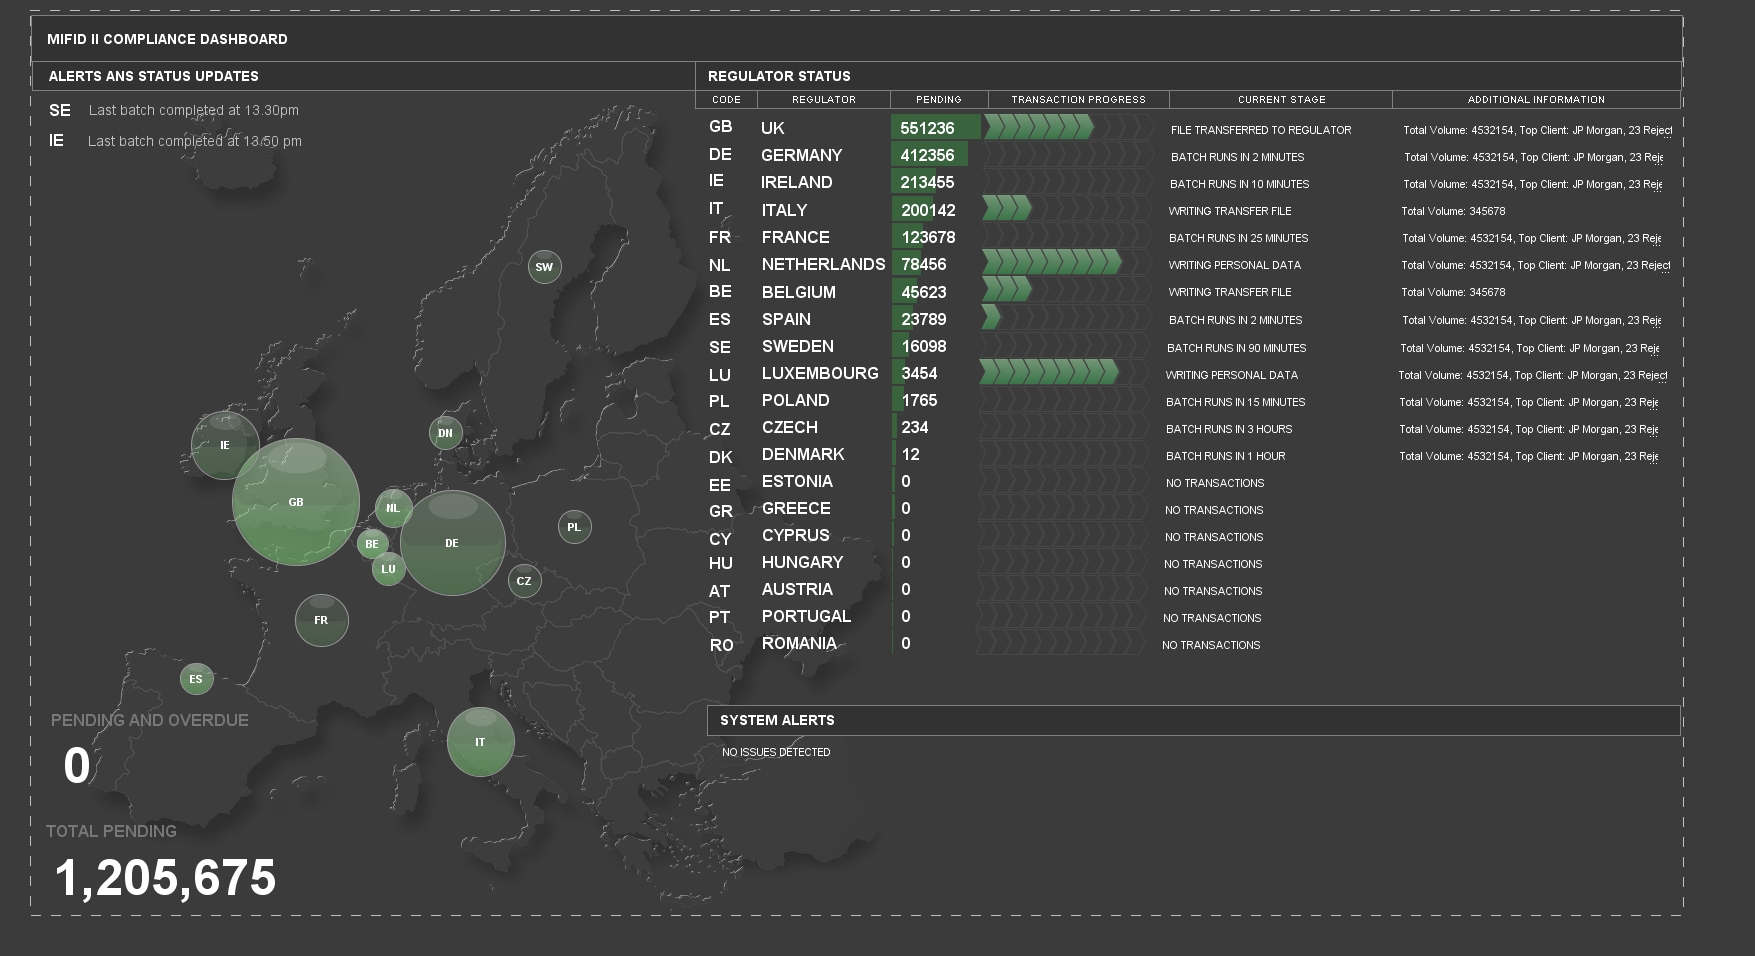
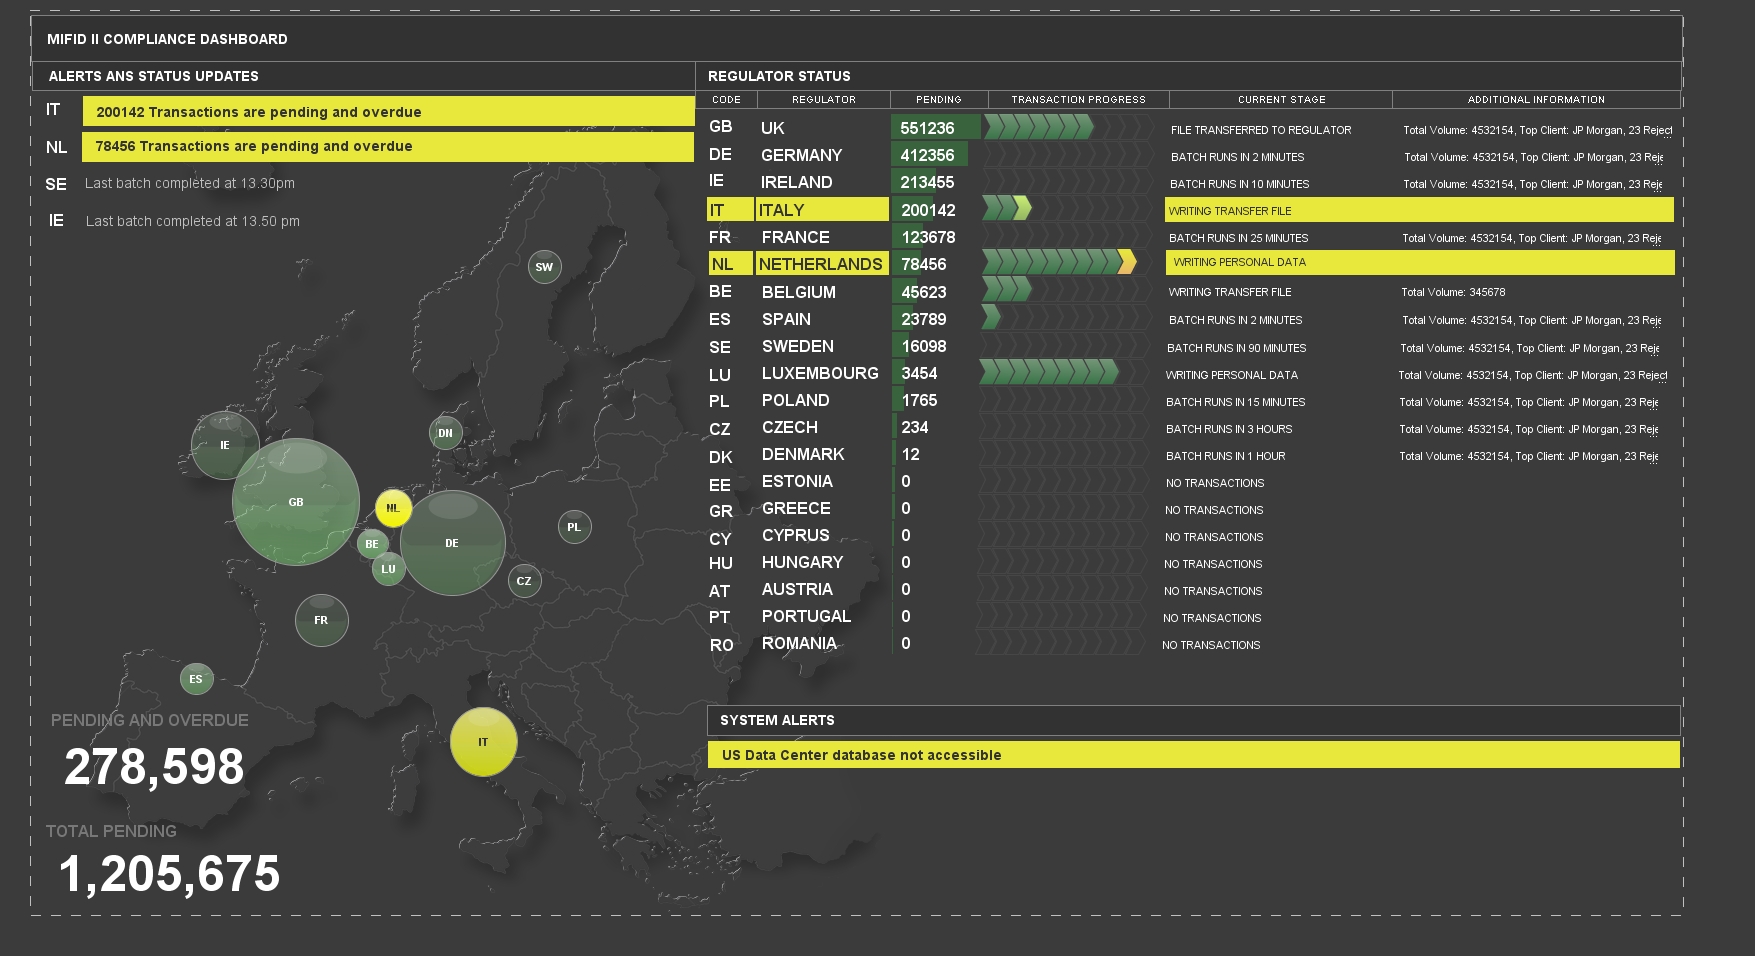
So rather than replicate the system infrastructure, the final versions of the dashboards focus on visualising the impact of those failures on the business. As unlogged trades build up in a given region the bubble graphic gets bigger, when the batch runs and logs the trades it reduces to a nominal size, then starts growing again. If there is a problem it goes yellow, if trades continue to grow it may go red and the bubble continues to increase in size. At any point users can establish if there is a failure, and the business exposure.
Like any dashboard it is important to consider the intended audience, in this case it’s the business users and managers, but by adding the progress of batch jobs on the individual regulators and high level details of failures (should any have occurred), it provides sufficient information for support staff to start an investigation when things start breaking, as well as meaningful information to the business level customers.
Dashboard showing business as usual
Dashboard developing alerts
By Simon Forey, Head of Managed Services and Client Services, ITRS Group.