New Prometheus & Alert Manager plugin for Geneos
Prometheus is an open-source systems' monitoring and alerting toolkit originally built by SoundCloud. It has an active developer community and many applications provide Prometheus monitoring by default.
Prometheus and Alert Manager data is now available in Geneos 5.10 with relatively minimal configuration, via the new Prometheus & Alert Manager plugin. To achieve this integration, we use the remote-write capability of Prometheus and the webhooks capability of Alert Manager to ensure that this data is streamed rather than polled for, in line with the real-time capabilities of Geneos monitoring.
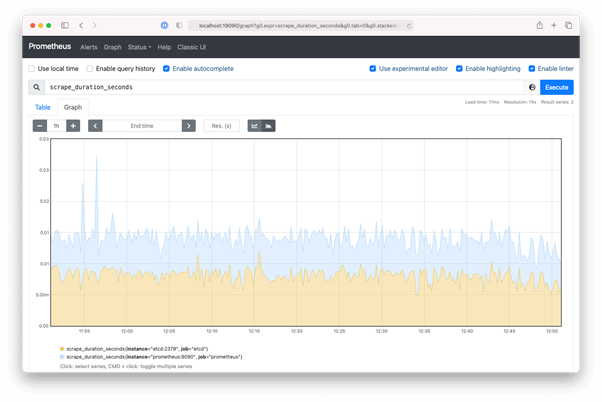
This means that all your Prometheus monitoring and alerting can now be made available in Geneos, alongside your existing infrastructure, market data and high-performance application monitoring. Here’s some example data in the Prometheus UI:

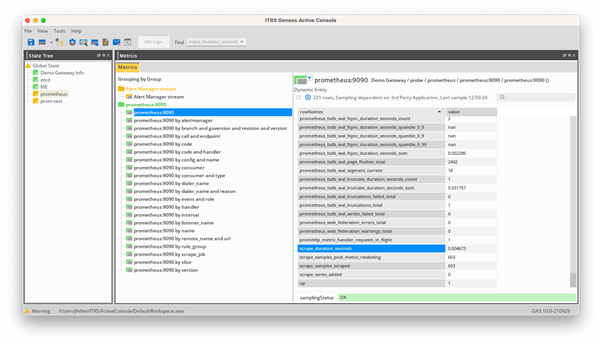
And that same data within Geneos:

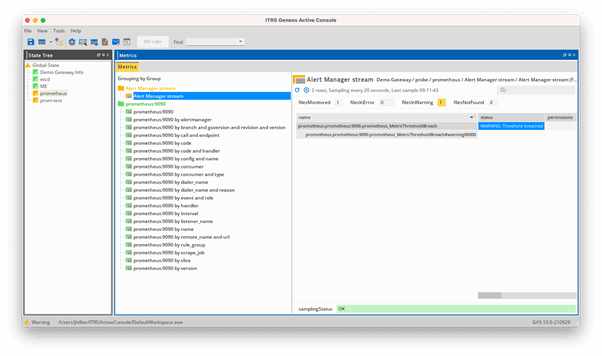
By default, we display all Alert Manager alerts as a stream, which can then be monitored using File Keyword Monitoring (FKM). In most cases, all alerts should be configured to generate an equivalent event in Geneos; in the example below, a metric breach warning is reflected as an FKM trigger and the managed entity for the Prometheus self-monitoring job is in warning state.

Because the metrics exposed by Prometheus are potentially unbounded, by default, we expose a subset of the metrics available, which can be customised to ensure access to your business-critical metrics. Although Netprobes and Gateways are not suited to horizontal scaling, the upcoming third version of Gateway Hub is designed to ingest Prometheus metrics directly, with load-balancing as required.
If you’d like to know more, please see the available documentation or contact your ITRS Account representative.


