Four easy ways to safeguard your APIs
More and more companies are embracing cloud-based apps and functionality mostly due to customer demand for seamless user experiences. SaaS applications are exploding in part because APIs serve as a bridge allowing developers to integrate tools seamlessly with cloud-based platforms.
There are around 200 million public and private APIs in use today, so it’s safe to say that they are important to business success and ROI. No doubt you’ve seen APIs in real-life situations. For example, without APIs to communicate between applications and assets, a travel website would have no way of querying which 10,000 hotel rooms were available in real-time.
Likewise, many websites would have trouble accepting credit card transactions. That’s why knowing the availability, speed, and validity of your API responses is crucial for many businesses. If an API fails to deliver in any of those areas, you’ve got trouble. Here are four metrics you can monitor to safeguard your APIs using Uptrends monitoring:
1. API availability monitoring
API uptime is one of the simplest and most inexpensive metrics you can monitor. Uptrends Webservice monitoring supports REST, and SOAP, as well as any webservices reachable through HTTP, HTTPS.
Using a global network of 233 checkpoints, alerts send out notifications and calculate the outage based on the time of the first confirmed error until the time of the first error-free test.
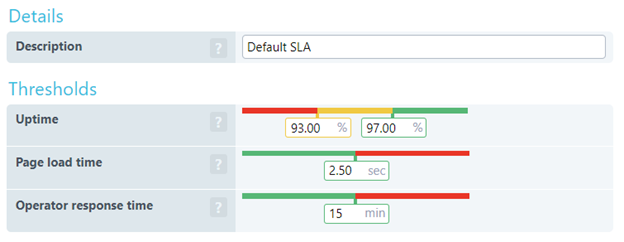
Tracking SLAs
If you have a service level agreement (SLA) with your API provider or users, you need to know what the uptime percentage is for the API. SLA monitoring keeps a running count of your uptime, making it easy to see what your availability looked like for a given period. SLA tracking lets you know if your API uptime is within your agreement, coming dangerously close to breaking your agreement, or if you’ve exceeded your allotted amount of unscheduled downtime.
2. API response time
Response time is a critical metric for some API interactions. Slow API responses can increase wait times, make applications appear choppy, and cause other functions to fail that rely on a fast response. The good news is that there are a couple of different ways to avoid these problems by tracking response times.
Tracking response time using web service monitors
Webservice HTTPS/HTTP uptime monitors track server response times so you can use the value as a basic response time metric and to trigger alerts. Detailed reports provide several different performance-related metrics:
• Load time: The total time it took to complete the test
• Resolve time: Time it took to resolve the URL to an IP address
• Connection time: Time it took to establish a connection to the server
• Download time: Time it took to complete the download once started
Tracking API response times using multi-step API monitoring
Multi-step API monitoring can track the response times, validate responses, and reuse data in future API calls. You can also track response times for each API call in the transaction, and by using assertions, you can verify that response times remain within a specified maximum. If the request surpasses the maximum step duration, the test fails.
3. Checking for latency
Latency is the amount of time it takes for a request or response to travel between the client and the host. It is affected by the distance traveled and any network congestion between the two. Latency from network congestion tends to be sporadic and may follow patterns based on the time of the day. However, latency due to distance is fairly constant.
To check for latency issues that your users may experience, we recommend using a ping monitor type. A ping test can give you the best information on latency because it bypasses the server’s processing of a regular API request.
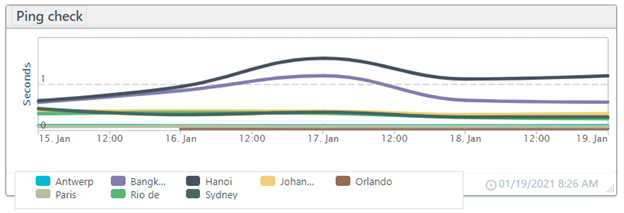
Although it does take time for the server to acknowledge the ping test, the time and resources needed for a server to formulate a response to a ping test are minimal and worth checking.
4. Tracking custom metrics
A custom metric is a numeric API response data point that you want to capture and track using multi-step API monitoring. You may have specific data in your responses that you want custom metrics on. For example, your API responds with the number of concurrent users, but you also want to monitor them alongside your API performance data.
You can capture the number of users and include them in your reporting to see how the metric changes over time. You can then generate reports that compare the number of users to your performance metrics. Custom metrics are especially useful in ecommerce, network, data center, and support scenarios.
Last words
APIs are evolving at breakneck speed to serve the needs of the digitally dependent world we live in. Because APIs provide a standard way of accessing applications, data and devices, they can be scaled based on need instead of investing in expensive in-house software.
Don’t get dumped for a competitor because your website or app fails to deliver reliable functionality. Track all the important metrics for the APIs you publish or third-party APIs your app or business depends on.
Uptrends monitoring gives you all the tools you need to verify availability, performance, latency, responses, and more.
Sign up for a free trial and see for yourself.